
پەڕگە:Hispanic and Latino Americans by county.png
قەبارەی ئەم پێشبینینە: ٨٠٠ لە ٤٢٧ پیکسەڵ. ڕێزەلووشنەکانی تر: ٣٢٠ لە ١٧١ پیکسەڵ | ٦٤٠ لە ٣٤١ پیکسەڵ | ١٬٠٢٤ لە ٥٤٦ پیکسەڵ | ١٬٢٨٠ لە ٦٨٣ پیکسەڵ | ٢٬٥٦٠ لە ١٬٣٦٥ پیکسەڵ | ٧٬٥٠٠ لە ٤٬٠٠٠ پیکسەڵ.
پەڕگەی سەرەکی (٧٬٥٠٠ × ٤٬٠٠٠ پیکسڵ، قەبارەی پەڕگە: ٤٫٤٧ مێگابایت، جۆری ئێم ئای ئێم ئی: image/png)

|
This map image could be re-created using vector graphics as an SVG file. This has several advantages; see Commons:Media for cleanup for more information. If an SVG form of this image is available, please upload it and afterwards replace this template with
{{vector version available|new image name}}.
It is recommended to name the SVG file “Hispanic and Latino Americans by county.svg”—then the template Vector version available (or Vva) does not need the new image name parameter. |
کورتە
| وەسف |
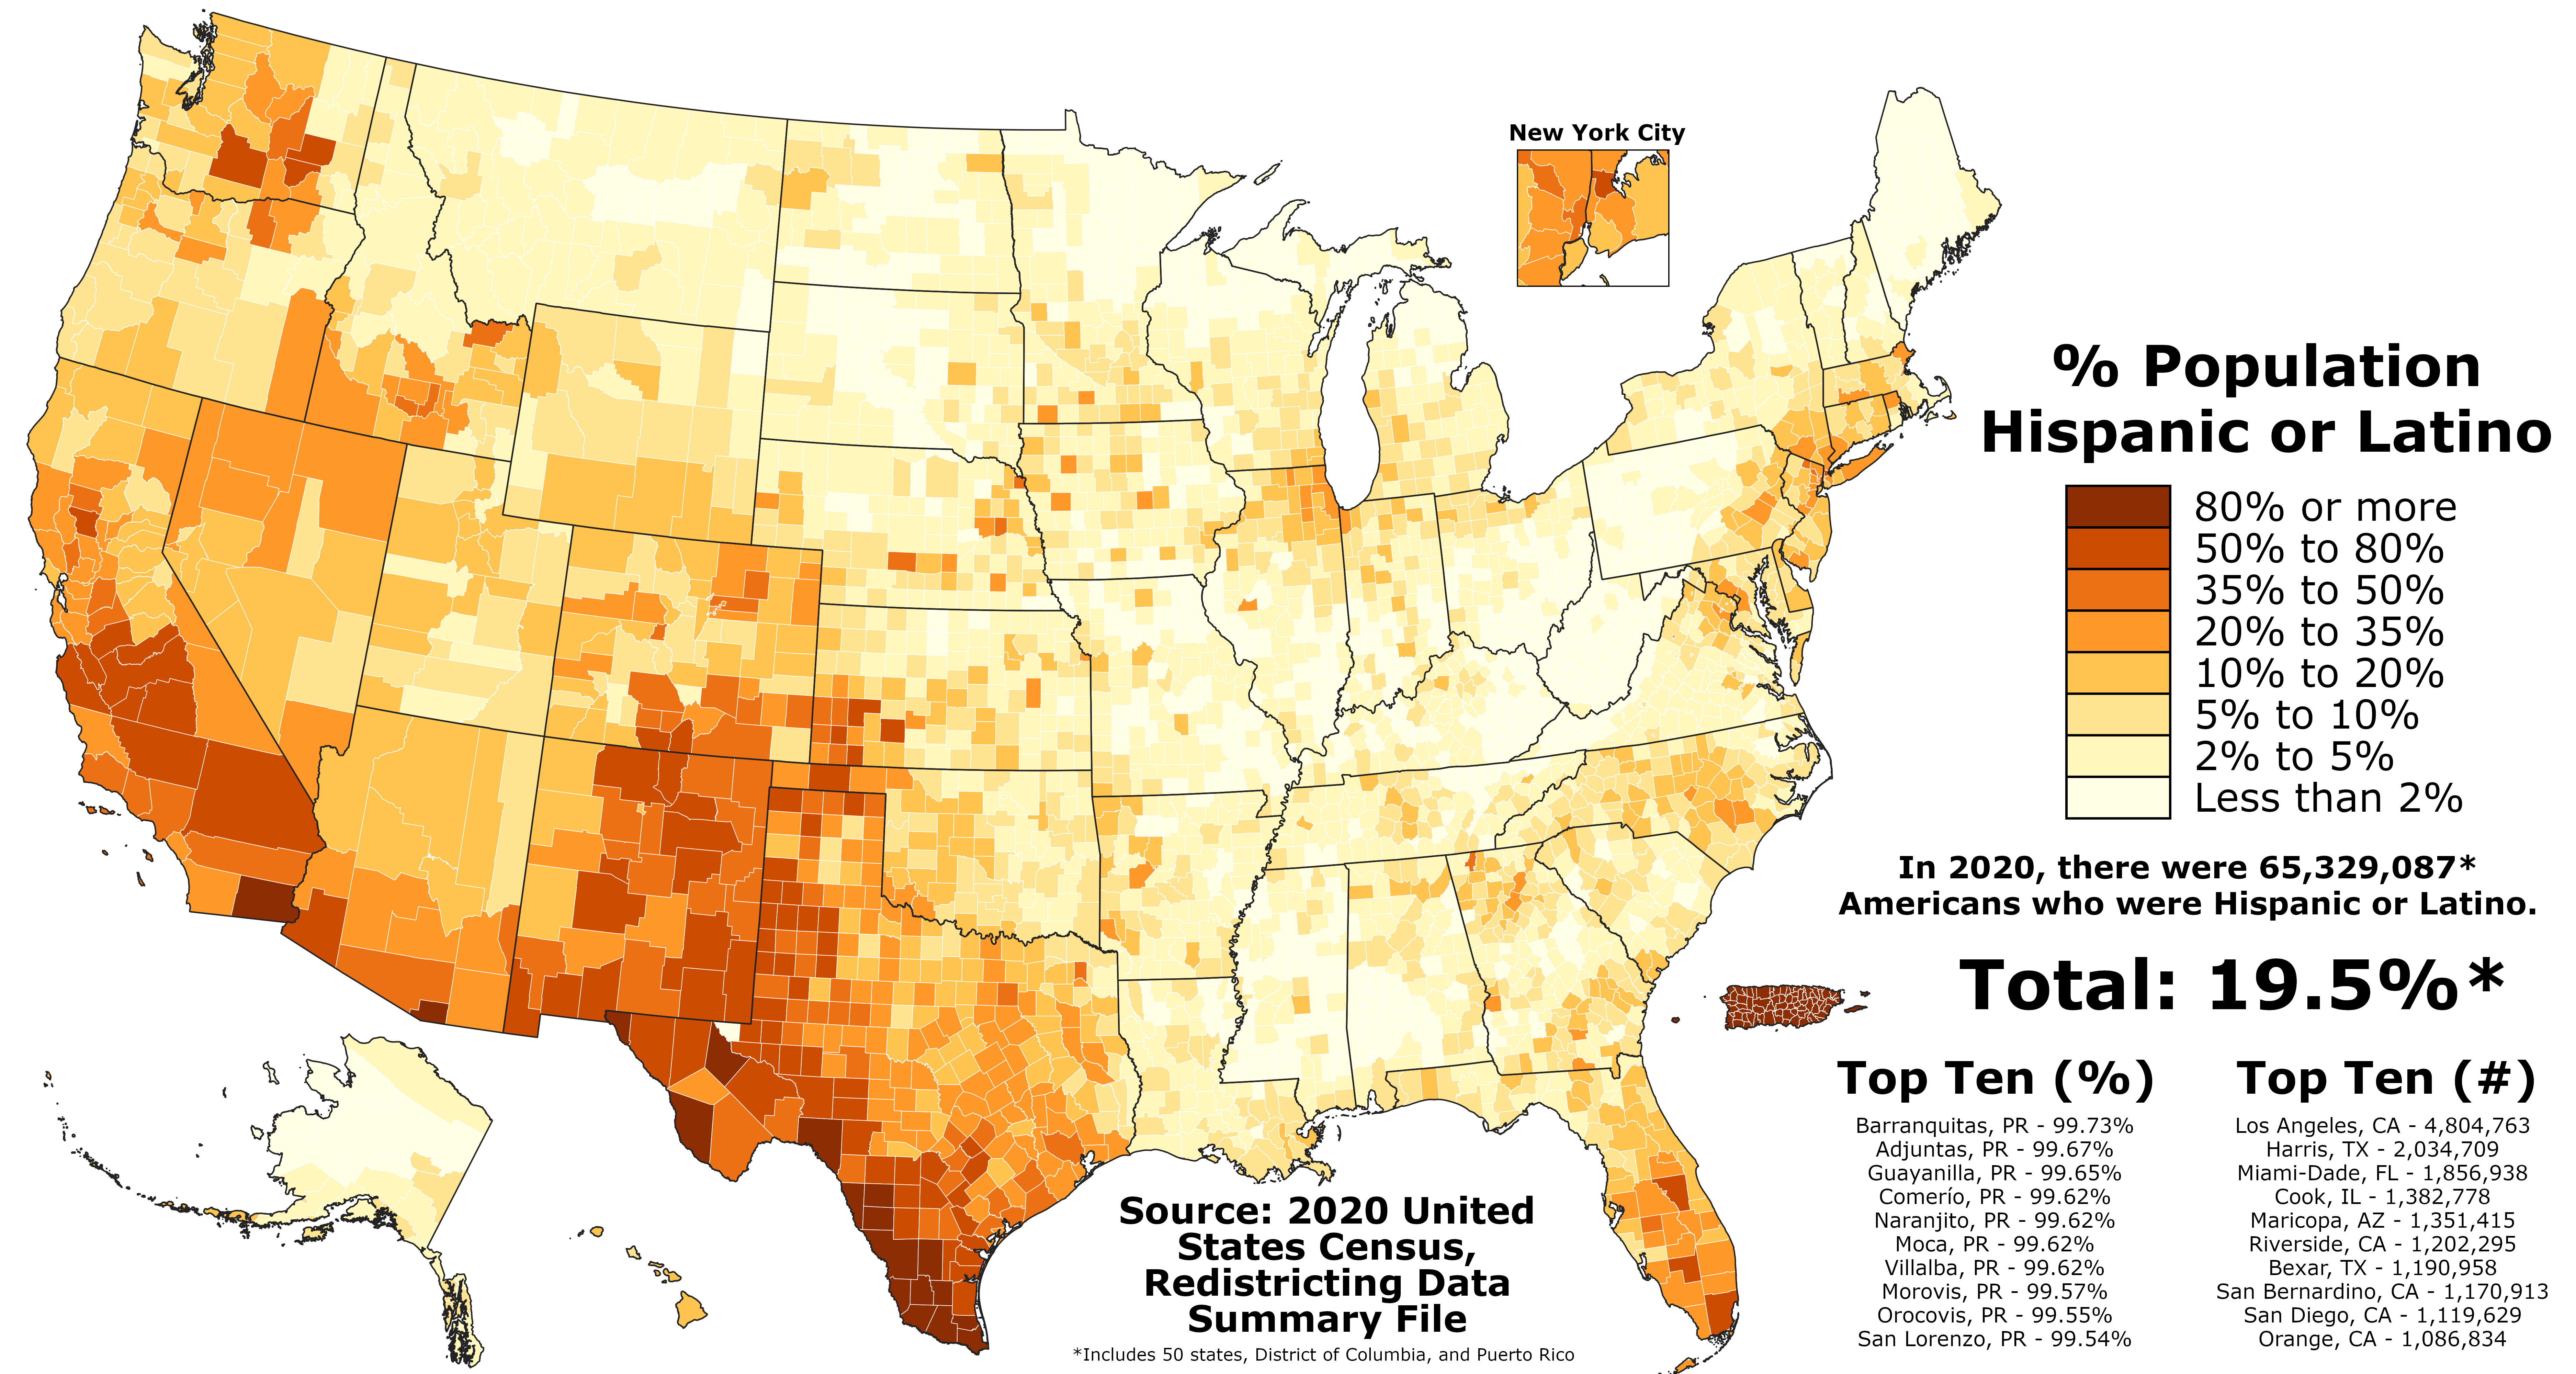
English: The map above shows the proportion of Americans who are Hispanic or Latino in each county in the fifty states, the District of Columbia, and Puerto Rico according to the official results of the 2020 United States Census. The data can be found here.
This file should next be updated when the 2021 Vintage Racial and Ethnic Population Estimates are released on the county level, currently expected to occur in June 2022. |
| ڕێکەوت | |
| سەرچاوە | بەرھەمی خۆم |
| بەرھەمھێنەر | Abbasi786786 |
مۆڵەتنامە
من، ھەڵگری مافی لەبەرگرتنەوەی ئەم بەرھەمە، لەژێر ئەم مۆڵەتنامەیەدا بڵاوی دەکەمەوە:
This file is licensed under the Creative Commons Attribution-Share Alike 4.0 International license.
- تۆ ئازادی:
- بۆ بڵاکردنەوە – بۆ کۆپی کردن، دابەشکردن و دەستبەدەست ناردنی
- بۆ تێکەڵکردنەوە – بۆ سازاندنی کارەکە
- بەم مەرجانەی خوارەوە:
- دانەپاڵ – پێویستە باوەڕی گونجاو بدەیت، بەستەرێک بۆ مۆڵەتەکە دابین بکەیت و ئاماژە بەوە بکەیت کە ئایا گۆڕانکاری کراوە یان نا. دەتوانیت بە هەر شێوەیەکی گونجاو ئەوە بکەیت، بەڵام بە شێوەیەک نا کە وا دەربکەوێت کە مۆڵەتدەر پشتگیری تۆ یان بەکارهێنانەکەت بکات.
- بڵاوکردنەوەی گونجاو – ئەگەر لەسەر بنەمای ئەم کارە تێکەڵ، گۆڕان، یان ساز بکەی، پێویستە بەشدارییەکانت بە هەمان مۆڵەت یان هاوشێوەی مۆڵەتی ئەسڵی دابەش بکەی.
مێژووی پەڕگە
کرتە بکە لەسەر یەکێک لە ڕێکەوت/کاتەکان بۆ بینینی پەڕگەکە بەو شێوەی لەو کاتەدا بووە.
| ڕێکەوت/کات | ھێما | ئەندازە | بەکارھێنەر | تێبینی | |
|---|---|---|---|---|---|
| هەنووکە | ٢٢:٠٩، ٦ی کانوونی یەکەمی ٢٠٢١ | | ٧٬٥٠٠ لە ٤٬٠٠٠ (٤٫٤٧ مێگابایت) | Abbasi786786 | Uploaded own work with UploadWizard |
بەکارھێنانی پەڕگە
ئەم پەڕەیە ئەم پەڕگەیە بەکار دەھێنێت:
بەکارھێنانی سەرانسەریی پەڕگە
ئەم ویکیانەی دیکەی خوارەوەش ئەم پەڕگە بەکاردێنن:
- بەکارھێنان لە az.wikipedia.org
- بەکارھێنان لە cs.wikipedia.org
- بەکارھێنان لە de.wikipedia.org
- بەکارھێنان لە el.wikipedia.org
- بەکارھێنان لە en.wikipedia.org
- بەکارھێنان لە es.wikipedia.org
- بەکارھێنان لە fr.wikipedia.org
- بەکارھێنان لە he.wikipedia.org
- بەکارھێنان لە simple.wikipedia.org
- بەکارھێنان لە uk.wikipedia.org
- بەکارھێنان لە vi.wikipedia.org